|
Larry Mahnken and SG's | ||
|
| Replacement Level Yankees Weblog |

|
|
"Hey, it's free!" | ||

|
|
|
Larry Mahnken and SG's | ||
|
| Replacement Level Yankees Weblog |
|
|
"Hey, it's free!" | ||
|
|
|
Featuring: Larry Mahnken SG sjohnny TVerik Sean McNally Fabian McNally John Brattain This is an awesome FREE site, where you can win money and gift certificates with no skill involved! If you're bored, I HIGHLY recommend checking it out!
The New York Yankees Vintage World Series Films DVD Set, available from A&E. Yankees Tickets World Series Tickets MLB All Star Tickets NFL Tickets Purchase your Onlineseats.com is your #1 source for MLB tickets, NY Mets Tickets, Cubs Tickets, Yankees Tickets, Red Sox Tickets, Giants Tickets, Astros Tickets, Angels Tickets, Phillies Tickets.
Buy all your MLB Tickets,
Laser Keyboard Brazil Flowers TickCo.com for premium New York Yankees Tickets Boston Red Sox Tickets Chicago white Sox Tickets A's Tickets Angels Tickets New York Mets Tickets St Louis Cardinals Tickets Cubs Tickets Dodgers Tickets Add the RLYW to My Yahoo! "I'm not a pessimist, I'm an optimist. Things are really worse than I say they are." - Steve South

January 2001 April 2003 May 2003 June 2003 July 2003 August 2003 September 2003 October 2003 November 2003 December 2003 January 2004 February 2004 March 2004 April 2004 May 2004 June 2004 July 2004 August 2004 September 2004 October 2004 November 2004 December 2004 January 2005 February 2005 March 2005 April 2005 May 2005 June 2005 July 2005 August 2005 September 2005 October 2005 November 2005 December 2005 January 2006 February 2006 March 2006 April 2006 May 2006 June 2006 July 2006 August 2006 September 2006 October 2006 November 2006 December 2006 January 2007 February 2007 March 2007 April 2007 May 2007 LINKS Yankees Sites and Columnists Nomaas.org General Baseball Sites & Columnists At Home Plate Rotoauthority.com The Book Blog - Playing the Percentages in Baseball(Tango, MGL, Dolphin) Yankees Blogs Almost Perfect Baby Bombers Baseball Mania Bronx Banter Bugs and Cranks Canyon of Heroes Dugout News Eephus Pitch Here Comes Number 27 High and Tight Lohud Yankees Blog No Sense Worrying Pinstripe Potentials River Ave. Blues Soft Hands The Stat Boy of the Empire Was Watching Yankees Chick Yankees Fans in Foreign Lands Yanks Blog Other Team Blogs Anaheim Angels All the Way Bucco Blog San Francisco Giants Blog Viva El Birdos Look what people have to say about Larry Mahnken's commentary! "Larry, can you be any more of a Yankee apologist?.... Just look past your Yankee myopia and try some objectivity." "Mr. Mahnken is enlightened."
"Wow, Larry. You've produced 25% of the comments on this thread and
said nothing meaningful. That's impressive, even for you."
"After reading all your postings and daily weblog...I believe you have truly become the Phil Pepe of this generation. Now this is not necessarily a good thing."
"you blog sucks, it reeds as it was written by the queer son of mike lupica and roids clemens. i could write a better column by letting a monkey fuk a typewriter. i dont need no 181 million dollar team to write a blog fukkk the spankeees"
"i think his followers have a different sexual preference than most men"
"Boring and predictable."
"Are you the biggest idiot ever?"
"I'm not qualified to write for online media, let alone mainstream
media."
This site is best viewed with a monitor.
|
Disclaimer: If you think this is the official website of the New York Yankees, you're an idiot. Go away. October 31, 2006
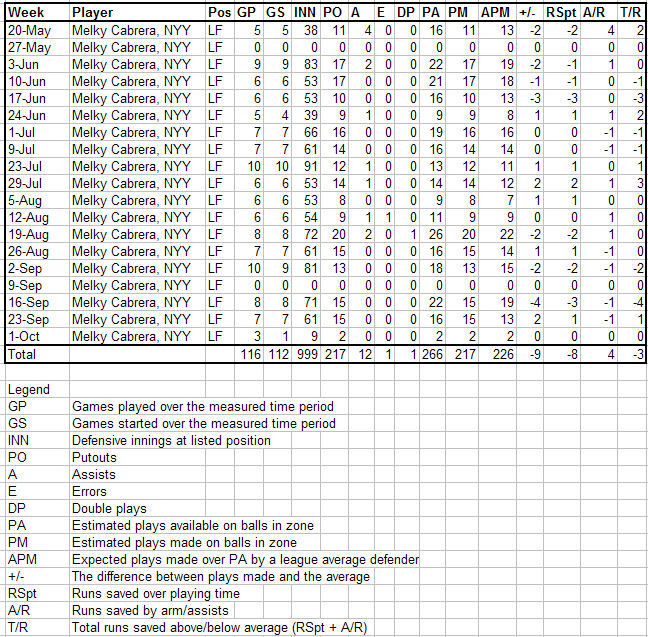
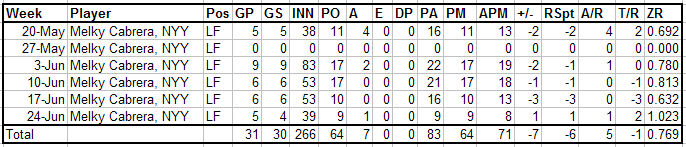
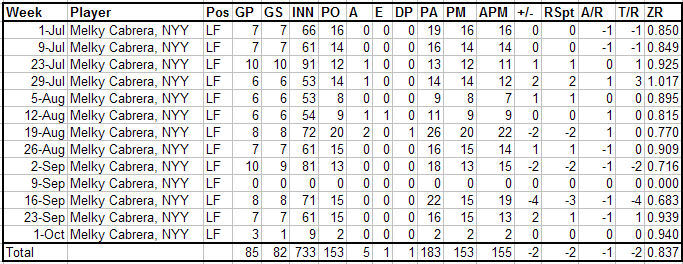
Melky's Defense by the Week by SG
One of the things I wanted to do this season in order to better understand how to assess the value players bring defensively was to track defense weekly. My hope was that doing this would allow me to see any patterns or changes in time periods, rather than a single year-end number.
| ||||||||||

